Healthcare Data Analyst | Building data driven solutions for better healthcare
Better healthcare depends on better decisions. My work focuses on providing the evidence behind those decisions.
I am a Healthcare Data Analyst focused on disease surveillance, population health, health systems, and digital health. I analyze healthcare data to identify patterns, evaluate trends, and communicate evidence that supports informed decisions. I believe the value of an analysis lies in the decisions it informs, not in the dashboards it produces.
My goal is to build data driven solutions that help health organizations respond to problems earlier, allocate resources more effectively, and improve care for the communities they serve.
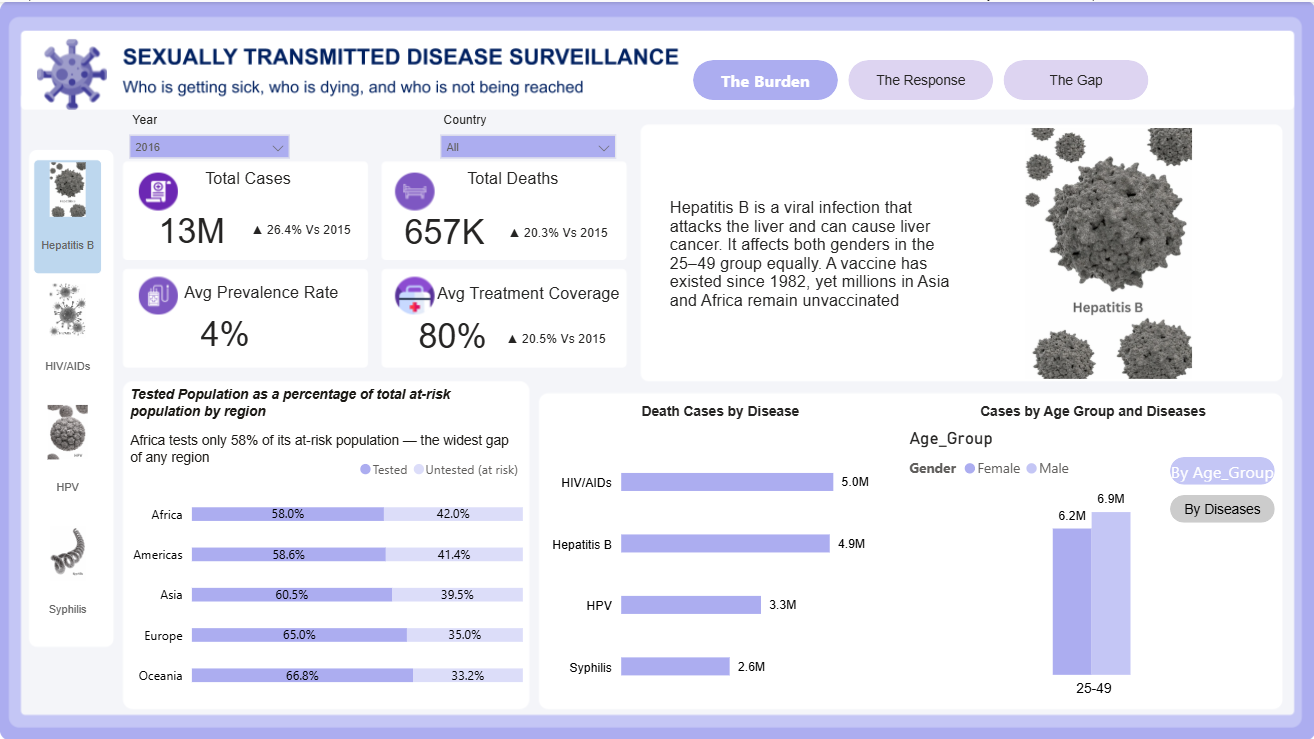
This project analyzed 11 years of infectious disease surveillance data across 12 countries to identify which populations, regions, and diseases represent the highest-priority gaps between disease burden and treatment access. The analysis found that HIV/AIDS account for largest share of death, and Africa as a region tests less than 60% of its at-risk population, this suggests testing infrastructure is the binding constraint. It also found that vaccination programs for HPV and Hepatitis B only show a measurable effect on new infections.
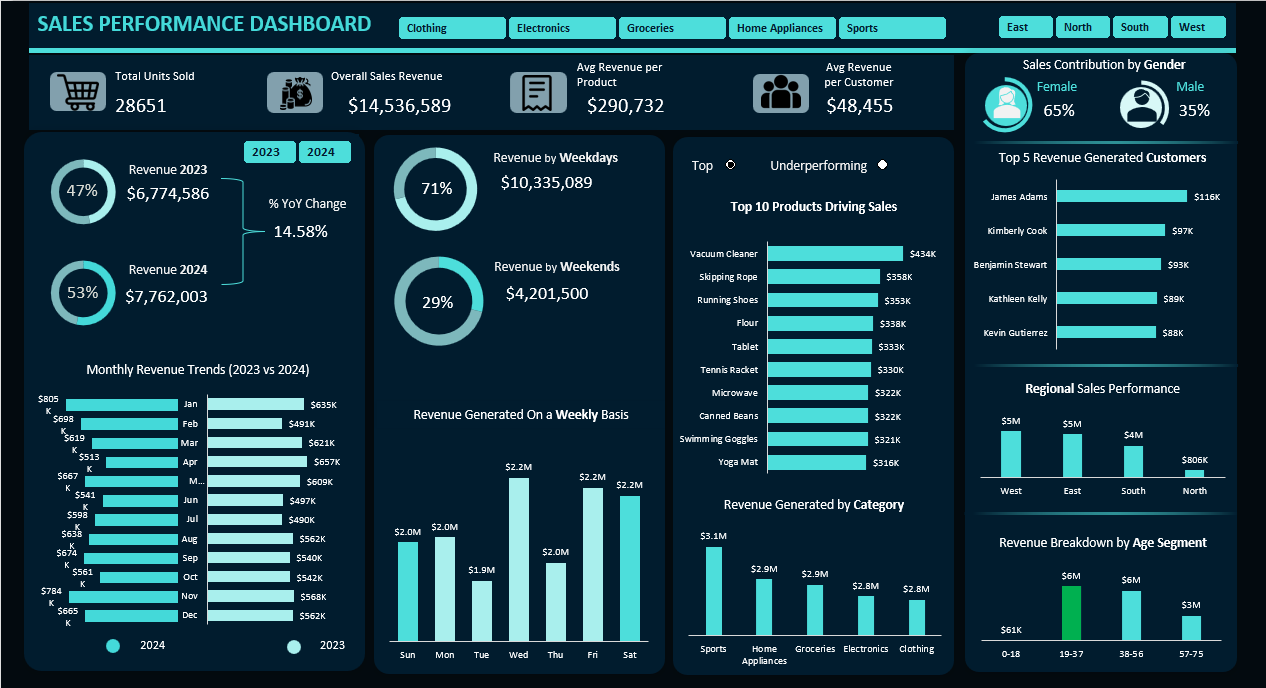
A retail business needed clearer visibity into its sales performance across products, customers, and regions but lacked a consolidated view of revenue drivers. This project analyzed transactional data using power query for data cleaning and transformation, and power pivot to build relationships across tables. The analysis revealed strong seasonal patterns, revenue concentration among products, and disproportionate contribution from specific customer segments.
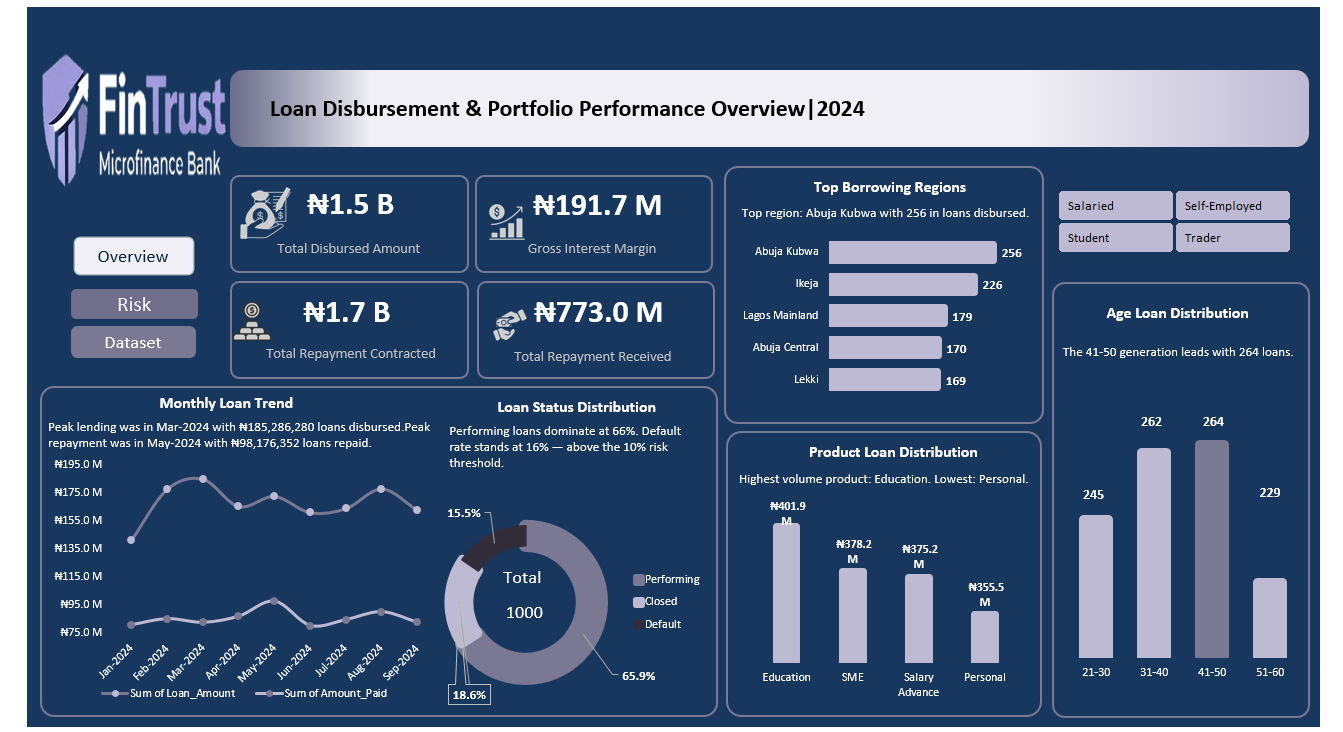
FinTrust MicroFinance Bank disbursed ₦1.5 billion across 1,000 loans in 2024 but had no consolidated view of whether that portfolio was generating sustainable profit or quietly accumulating default risk. This project analysed three datasets — customers, loans, and payments — using Power Query for data cleaning and transformation, Power Pivot to build relationships across tables, and Excel to build an interactive dashboard. The analysis revealed that while the bank's scheduled ROI sits at 12.69%, only 45.4% of contracted repayments have been collected in cash, the default rate exceeds the CBN threshold by 55%, and the credit scoring model has near-zero predictive power.
Analyzed 2,500 patient records to determine how smoking behavior, alcohol consumption, and demographic factors drive organ damage across five organ systems — with findings visualized in an interactive Power BI dashboard featuring organ-switching imagery.